
An Increase in Supply
Supply changes for any of the four reasons listed in the previous section.
An increase in supply 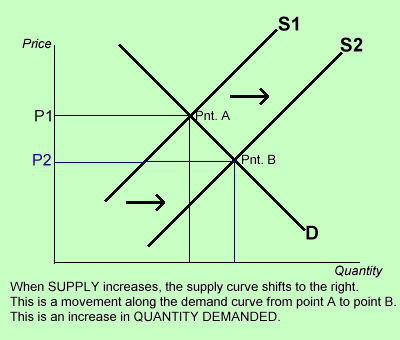 is illustrated by a rightward shift of the supply curve. This decreases the price and increases the quantity sold.
is illustrated by a rightward shift of the supply curve. This decreases the price and increases the quantity sold.A Decrease in Supply
A decrease in supply is illustrated by a leftward shift of the supply curve. This increases the price and decreases the quantity sold.